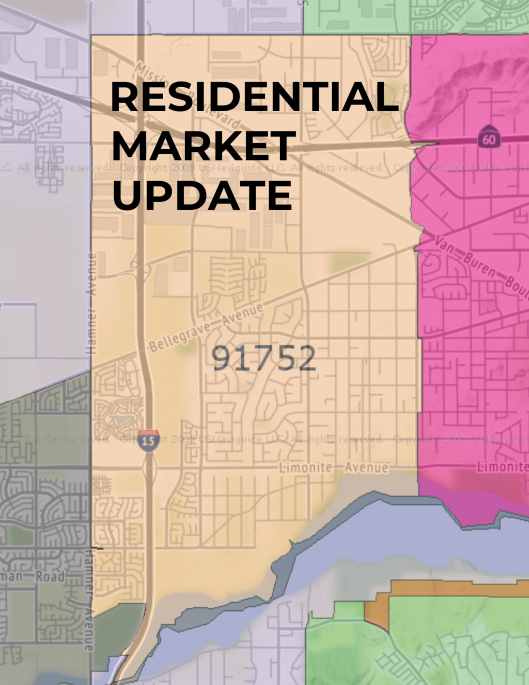
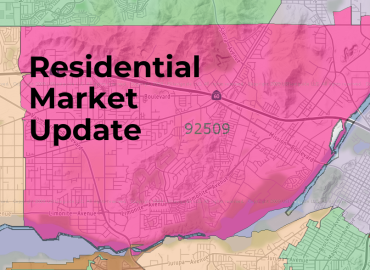
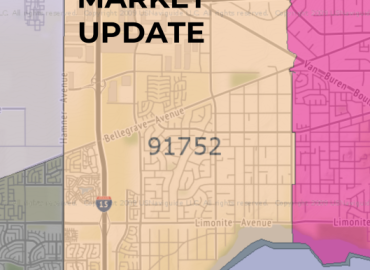
91752 Residential Real Estate Market Update (Jurupa Valley-Eastvale) – May 2024
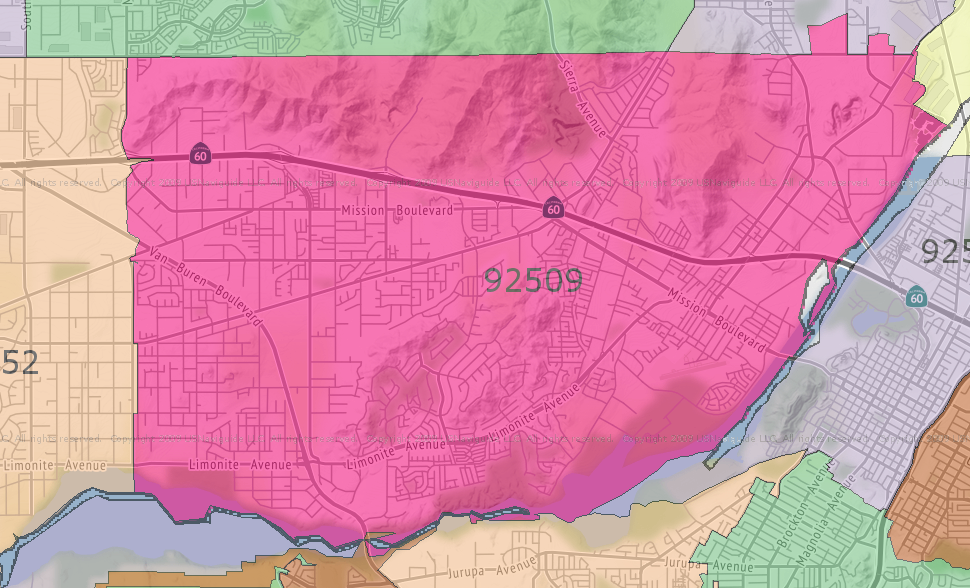
The 91752-zip code, located in Riverside County, California, encompasses a small part of Eastvale (east of Hamner Avenue) and the western part of Jurupa Valley (Mira Loma area). The history of the ’52 zip code is closely tied to the development of these communities. Here’s a brief overview:
Throughout the 19th and early 20th centuries, the area was predominantly agricultural. It was known for its dairy farms and fields of crops, which benefited from the region’s fertile soil and favorable climate.
After World War II and into the 20th century, the region began to transform like many areas in Southern California. The growth of the Los Angeles metropolitan area, transportation improvements, and the increasing demand for suburban housing led to the development of residential communities, eventually becoming the cities of Eastvale and Jurupa Valley.
Today, the 91752-zip code is characterized by its suburban residential communities, commercial developments, and remaining agricultural areas. It reflects the more significant trends in Southern California’s Inland Empire – a shift from rural to suburban and urban landscapes.
The history of the 91752-zip code is a microcosm of the broader changes in Southern California – from indigenous lands to agricultural heartland to a thriving suburban area. It reflects the dynamic and ever-evolving nature of the region.
The following data is not intended to be a comparative market analysis for any one particular home but instead gives a general valuation for homes in each of the 12 specified areas and the entire residential areas located in the 91752-zip code.
For a detailed and personalized market analysis of your home, or if you have any questions, please get in touch with me.
Manny Barba,
Broker-Attorney-Realtor®
DRE #00879806
951-990-3998
mail@mbliverealty.com
MB Live Realty, Inc.
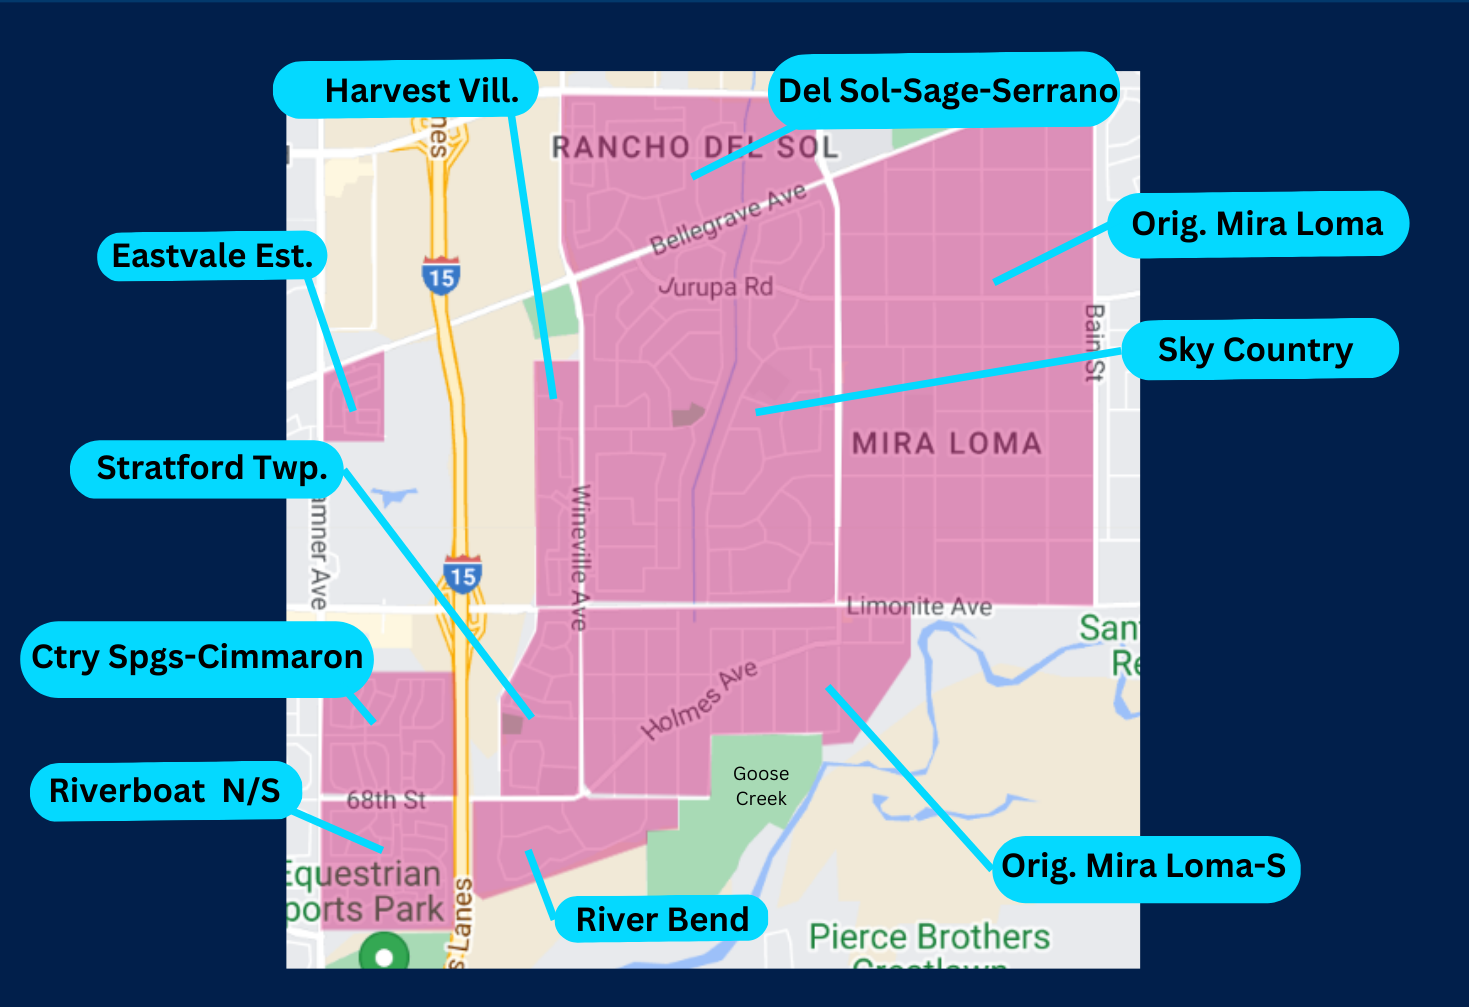
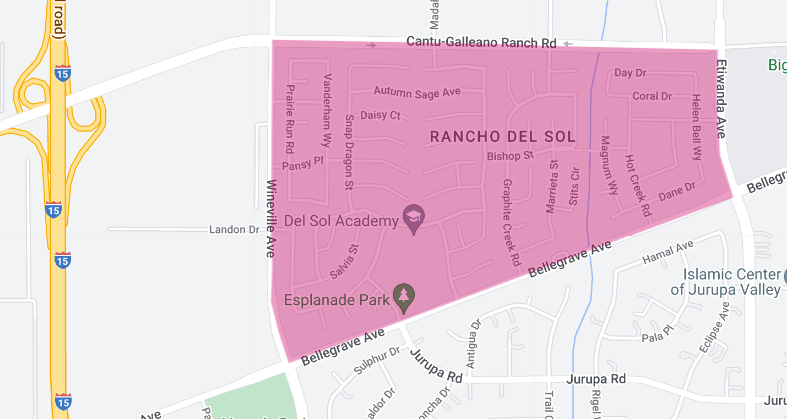
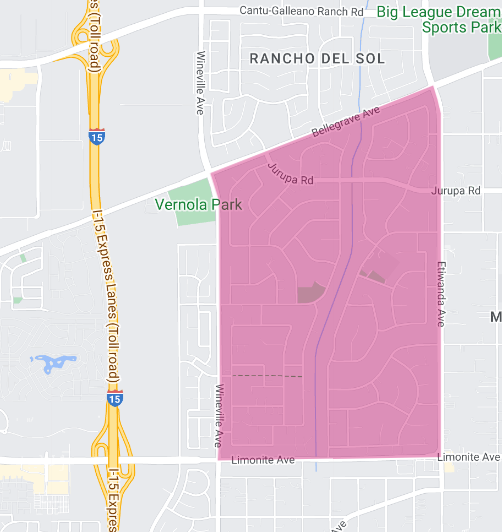
Area 1: Rancho Del Sol-Sage Pointe-Serrano Ranch area of homes,
(Western portion of Jurupa Valley 91752 )
End of Month Active Listings: 4, -20.0% change from last year
New Listings: 3, +200.0% change from last year
Months Supply Inventory: 1.8, -14.3% change from last year
Closed Sales: 3 , +50.0% change from last year
Average Days on Market: 10, -94.4% change from last year
List to Sold Price %: 111.4% , +9.3% change from last year
Average Sales Price: $905,000, +8.4% change from last year.
Average Price Square Foot: $302, -3.2 change from last year.
As of the end of May 2024, the residential real estate market in the Rancho Del Sol-Sage-Serrano Ranch area has exhibited notable changes, reflecting various shifts in inventory, sales activity, and pricing metrics. Below is a detailed analysis of the current market conditions based on the latest data.
The number of active listings in Rancho Del Sol-Sage-Serrano Ranch at the end of May was 4, representing a 20.0% decrease compared to the same period last year. This reduction in active listings indicates a tighter inventory, suggesting limited options for prospective buyers. However, the market saw 3 new listings during May, marking a substantial 200.0% increase from last year. This significant rise in new listings points to a robust inflow of fresh inventory, providing more choices for buyers.
The months supply of inventory has decreased to 1.8 months, reflecting a 14.3% drop from last year. This metric suggests a seller’s market, where the limited supply relative to demand is likely driving up competition among buyers.
Closed sales in May totaled 3, representing a 50.0% increase from last year. This notable rise in closed transactions highlights strong buyer demand and a healthy level of market activity. Additionally, the average days on market for properties in Rancho Del Sol-Sage-Serrano Ranch decreased significantly to 10 days, a remarkable 94.4% reduction from last year. This sharp decline suggests that properties are selling exceptionally quickly, reflecting strong buyer interest and swift decision-making.
The list-to-sold price percentage increased to 111.4%, reflecting a 9.3% rise from last year. This figure indicates that homes are selling for well above their asking prices on average, underscoring a highly competitive market where buyers are willing to bid higher to secure a purchase.
The average sales price in Rancho Del Sol-Sage-Serrano Ranch stood at $905,000, representing an 8.4% increase from last year. This rise in sales price highlights continued appreciation in property values within the area. Conversely, the average price per square foot decreased slightly to $302, marking a 3.2% decline from a year ago. This minor decrease suggests potential variations in the types of properties being sold or changes in buyer preferences.
In summary, the Rancho Del Sol-Sage-Serrano Ranch residential real estate market as of May 2024 is characterized by a decrease in active listings, a significant increase in new listings, and a highly competitive seller’s market. Properties are selling quickly and for well above their asking prices. The increases in average sales prices, combined with a slight decrease in price per square foot, indicate strong market dynamics and ongoing demand for properties in the area. Buyers and sellers in Rancho Del Sol-Sage-Serrano Ranch should work closely with experienced real estate professionals to navigate these evolving market conditions and make informed decisions.
Note: The above data is not intended to be a comparative market analysis for any one particular home. The above data provides an average valuation for homes sold in this area for the specified period.
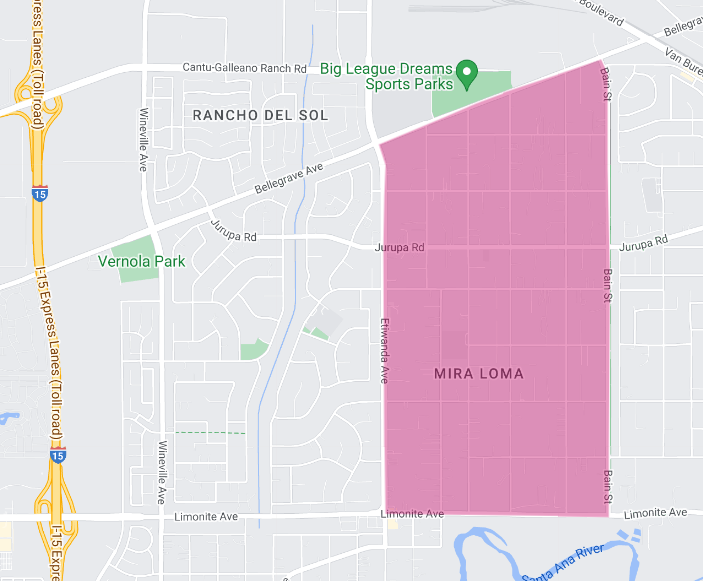
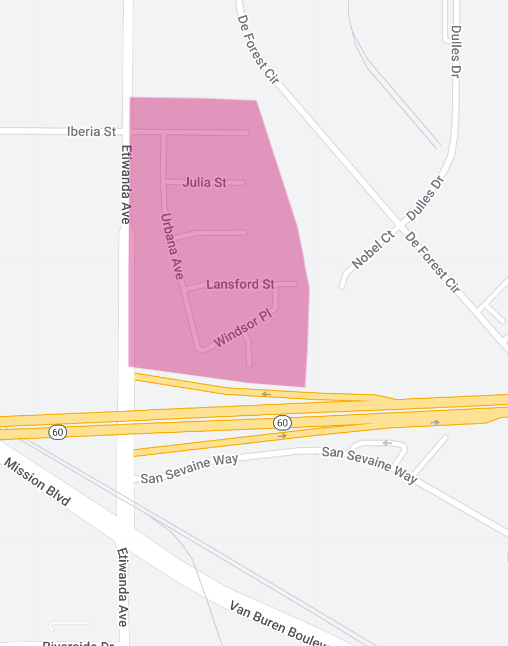
Area 2: Central Mira Loma (original)
(Western portion of Jurupa Valley 91752)
End of Month Active Listings: 2, -60.0% change from last year
New Listings: 2 , +100.0% change from last year
Months Supply Inventory: 1.2, -61.3% change from last year
Closed Sales: 1 , 0.0% change from last year
Average Days on Market: 5, -95.1% change from last year.
List to Sold Price %: 103.8%, +8.5%
Average Sales Price: $597,500, -6.6% change from last year, calculated using a rolling 3-month average.
Average Price Square Foot: $502, +3.3% change from last year, calculated using a rolling 3-month average.
As of the end of May 2024, the residential real estate market in the original Mira Loma area has experienced significant changes, reflecting shifts in inventory levels, sales activity, and pricing dynamics. Below is a comprehensive analysis of the current market conditions based on the latest data.
The number of active listings in Original Mira Loma at the end of May was 2, representing a substantial 60.0% decrease compared to the same period last year. This significant reduction in active listings indicates a tighter inventory, suggesting limited options for prospective buyers. However, the market saw 2 new listings during May, marking a 100.0% increase from last year. This rise in new listings points to an inflow of fresh inventory, providing more choices for buyers.
The months supply of inventory has decreased to 1.2 months, reflecting a 61.3% drop from last year. This metric suggests a strong seller’s market, where the limited supply relative to demand is likely driving up competition among buyers.
Closed sales in May totaled 1, with no change from last year. This stability in closed transactions highlights steady demand and market activity. The average days on market for properties in Original Mira Loma decreased significantly to 5 days, a remarkable 95.1% reduction from last year. This sharp decline suggests that properties are selling exceptionally quickly, reflecting strong buyer interest and swift decision-making.
The list-to-sold price percentage increased to 103.8%, reflecting an 8.5% rise from last year. This figure indicates that homes are selling for well above their asking prices on average, underscoring a highly competitive market where buyers are willing to bid higher to secure a purchase.
The average sales price in Original Mira Loma, calculated using a rolling 3-month average, stood at $597,500. This figure represents a 6.6% decrease from last year, suggesting potential changes in the types of properties being sold or a shift in market dynamics. Conversely, the average price per square foot increased to $502, also calculated using a rolling 3-month average, marking a 3.3% rise from last year. This increase indicates that buyers are valuing property space more highly, possibly due to enhanced property features or increased demand for quality living spaces.
In summary, the Original Mira Loma residential real estate market as of May 2024 is characterized by a significant decrease in active listings, a rise in new listings, and a highly competitive seller’s market. Properties are selling quickly and for above their asking prices. The decreases in average sales prices, combined with increases in price per square foot, indicate shifts in market conditions and property valuations. Buyers and sellers in Original Mira Loma should work closely with experienced real estate professionals to navigate these evolving market dynamics and make informed decisions.
Note: The above data is not intended to be a comparative market analysis for any one particular home. The above data provides an average valuation for homes sold in this area for the specified period.
Area 3: Sky Country,
(Western portion of Jurupa Valley 91752 )
End of Month Active Listings: 4, +100.0% change from year ago,
New Listings: 4, 0.0% change from year ago,
Months Supply Inventory: 2.2, +175.0% change from year ago,
Closed Sales: 3 , no data re change from a year ago,
Average Days on Market: 36, no data re change from a year ago,
List to Sold Price %: 93.8%, no data re change from a year ago,.
Average Sales Price: $855,633, no data re change from a year ago,
Average Price Square Foot: $385, no data re change from a year ago,
As of the end of May 2024, the residential real estate market in Sky Country has demonstrated notable changes, reflecting shifts in inventory, sales activity, and pricing dynamics. Below is a detailed analysis of the current market conditions based on the latest data.
The number of active listings in Sky Country at the end of May was 4, representing a 100.0% increase compared to the same period last year. This significant rise in active listings indicates a greater availability of homes for prospective buyers, suggesting a more balanced market. Additionally, the market saw 4 new listings during May, unchanged from last year, pointing to a steady inflow of fresh inventory.
The months supply of inventory has increased to 2.2 months, reflecting a 175.0% rise from last year. This metric indicates a more balanced market compared to the previous year when inventory levels were lower, suggesting that it would take 2.2 months to sell the current inventory at the present rate of sales.
Closed sales in May totaled 3, with no comparative data available from last year. The average days on market for properties in Sky Country was 36 days, also with no comparative data from last year. These figures suggest that properties are taking just over a month to sell, indicating a healthy level of market activity and buyer interest.
The list-to-sold price percentage was 93.8%, with no change data from last year. This figure indicates that homes are selling for slightly below their asking prices on average, reflecting a balanced negotiation environment between buyers and sellers.
The average sales price in Sky Country stood at $855,633, with no comparative data from last year. This figure highlights the value of properties within the area. Additionally, the average price per square foot was $385, also with no comparative data from last year. These metrics suggest a strong valuation of property space, reflecting ongoing demand and market strength.
In summary, the Sky Country residential real estate market as of May 2024 is characterized by increased active listings and a balanced months supply of inventory. The market remains competitive, with properties selling at a slight discount to their listing prices. The average sales prices and price per square foot indicate strong demand and value for properties in the area. Buyers and sellers in Sky Country should work closely with experienced real estate professionals to navigate these evolving market dynamics and make informed decisions.
Note: The above data is not intended to be a comparative market analysis for any one particular home. The above data provides an average valuation for homes sold in this area for the specified period.
Area 4: Mira Loma – South (original)
(Western portion of Jurupa Valley 91752)
End of Month Active Listings: 3 , no data re change from last year.
New Listings: 3 , no data re change from last year.
Months Supply Inventory: 2.4 , no data re change from last year.
Closed Sales: 1 , no data re change from last year.
Average Days on Market: 51, no data re change from last year.
List to Sold Price %: 100.0%, no data re change from last year.
Average Sales Price: $775,000 , +8.1% change from last year, calculated using a rolling 3-month average,
Average Price Square Foot: $537, +72.1% change from last year, calculated using a rolling 3-month average.
As of the end of May 2024, the residential real estate market in the original Mira Loma-South area has demonstrated stability in various metrics, alongside significant changes in pricing dynamics. Below is a detailed analysis of the current market conditions based on the latest data.
The number of active listings in Original Mira Loma-South at the end of May was 3, with no comparative data from last year. This suggests a stable inventory level, providing consistent availability of homes for prospective buyers. Similarly, the market saw 3 new listings during May, indicating a steady inflow of fresh inventory with no change from last year.
The months supply of inventory stands at 2.4 months, also with no change from last year. This metric suggests a balanced market where the supply of homes aligns with the demand, allowing for healthy competition among buyers.
Closed sales in May totaled 1, with no change data available from last year. The average days on market for properties in Original Mira Loma-South was 51 days, indicating the time properties spend on the market before being sold, with no comparative data from last year. These figures suggest a steady pace of sales activity.
The list-to-sold price percentage remained at 100.0%, indicating that homes are selling at their asking prices on average. This stability suggests a balanced negotiation environment between buyers and sellers.
The average sales price in Original Mira Loma-South, calculated using a rolling 3-month average, was $775,000. This figure represents an 8.1% increase from last year, highlighting a rise in property values within the area. Additionally, the average price per square foot increased significantly to $537, marking a substantial 72.1% rise from last year. This significant increase suggests a higher valuation of property space, reflecting ongoing demand and market strength.
In summary, the Original Mira Loma-South residential real estate market as of May 2024 is characterized by stable active listings, new listings, and a balanced months supply of inventory. The market remains competitive, with properties selling at their asking prices. The increases in average sales prices and price per square foot indicate strong demand and value for properties in the area. Buyers and sellers in Original Mira Loma-South should work closely with experienced real estate professionals to navigate these evolving market dynamics and make informed decisions.
Note: The above data is not intended to be a comparative market analysis for any one particular home. The above data provides an average valuation for homes sold in this area for the specified period.
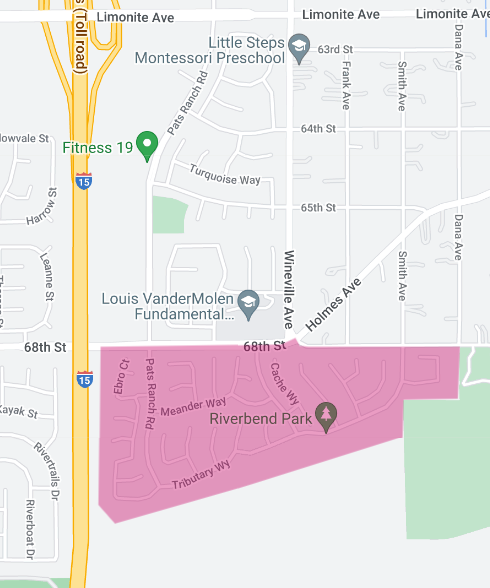
Area 5: River Bend Homes
(Western Edge of Jurupa Valley 91752)
End of Month Active Listings: 7 , +40.0% change from last year.
New Listings: 3 , -25.0% change from last year.
Months Supply Inventory: 2.9, +3.6% change from last year
Closed Sales: 1, no data re change from last year
Average Days on Market: 8 , no data re change from last year
List to Sold Price %: 102.5%, no data re change from last year
Average Sales Price: $854,000 , +22.0% change from last year, calculated using a 3-month rolling average.
Average Price Square Foot: $342, -5.5% change from last year, calculated using a 3-month rolling average.
As of the end of May 2024, the residential real estate market in the River Bend area has experienced several significant changes, reflecting shifts in inventory levels, sales activity, and pricing dynamics. Below is a comprehensive analysis of the current market conditions based on the latest data.
The number of active listings in River Bend at the end of May was 7, representing a 40.0% increase compared to the same period last year. This rise in active listings indicates a greater availability of homes for prospective buyers, suggesting a more balanced market. However, the market saw 3 new listings during May, marking a 25.0% decrease from last year. This reduction in new listings could point to a slowing influx of fresh inventory, which may tighten the market in the coming months.
The months supply of inventory has increased slightly to 2.9 months, reflecting a 3.6% rise from last year. This metric indicates a balanced market where the supply of homes is relatively aligned with demand, allowing for healthy competition among buyers.
Closed sales in May totaled 1, with no comparative data available from last year. The average days on market for properties in River Bend was 8 days, also with no comparative data from last year. These figures suggest that properties are selling quickly, reflecting strong buyer interest and efficient market activity.
The list-to-sold price percentage was 102.5%, with no change data from last year. This figure indicates that homes are selling for slightly above their asking prices on average, underscoring a competitive market where buyers are willing to bid higher to secure a purchase.
The average sales price in River Bend, calculated using a rolling 3-month average, stood at $854,000. This figure represents a 22.0% increase from last year, highlighting significant appreciation in property values within the area. Conversely, the average price per square foot decreased slightly to $342, marking a 5.5% decline from last year. This decrease suggests potential changes in the types of properties being sold or a shift in buyer preferences.
In summary, the River Bend residential real estate market as of May 2024 is characterized by increased active listings, a balanced months supply of inventory, and quick sales activity. The market remains competitive, with properties selling above their asking prices. The increases in average sales prices, combined with a slight decrease in price per square foot, indicate strong market dynamics and ongoing demand for properties in the area. Buyers and sellers in River Bend should work closely with experienced real estate professionals to navigate these evolving market conditions and make informed decisions.
Note: The above data is not intended to be a comparative market analysis for any one particular home. The above data provides an average valuation for homes sold in this area for the specified period.
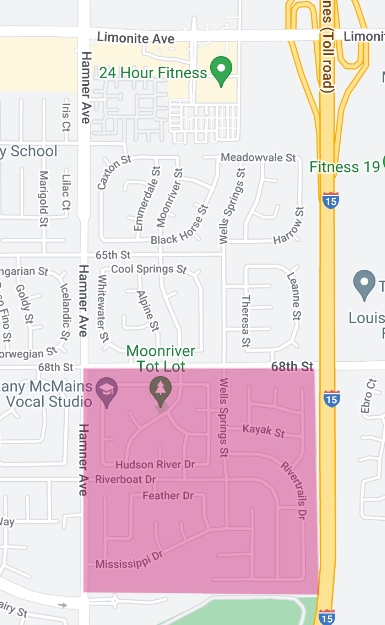
Area 6: Riverboat Dr. Area Homes
(Western Edge of 91752 ZIP Code, Eastvale, CA)
End of Month Active Listings: 2, +100.0% change from last year.
New Listings: 1, 0.0% change from last year.
Months Supply Inventory: 1.6, +128.6% change from last year.
Closed Sales: 0, -100.0% change from last year.
Average Days on Market: no data due to no closed sales.
List to Sold Price %: no data due to no closed sales.
Average Sales Price: $1,017,500, +26.5% change from a year ago, calculated using a rolling 3-month average.
Average Price Square Foot: $274, +1.1% change from last year, calculated using a rolling 3-month average.
As of the end of May 2024, the residential real estate market in the area adjacent to Riverboat Dr. (north and south) has shown significant changes, particularly in inventory levels and pricing dynamics. Below is a detailed analysis of the current market conditions based on the latest data.
The number of active listings in the Riverboat Dr. area at the end of May was 2, representing a 100.0% increase compared to the same period last year. This doubling of active listings suggests an improvement in the availability of homes for prospective buyers, providing more options in the market. The market saw 1 new listing during May, which is unchanged from last year, indicating a steady inflow of fresh inventory.
The months supply of inventory has increased to 1.6 months, reflecting a substantial 128.6% rise from last year. This metric indicates a shift towards a more balanced market, though still favoring sellers, as the supply of homes relative to the demand has increased.
There were no closed sales in May, representing a 100.0% decrease from last year. The absence of closed transactions means there is no available data for average days on market or the list-to-sold price percentage for this period. This lack of closed sales could be due to various factors, including potential seasonal variations or other market dynamics.
The average sales price in the Riverboat Dr. area, calculated using a rolling 3-month average, was $1,017,500. This figure represents a substantial 26.5% increase from last year, highlighting significant appreciation in property values within the area. Additionally, the average price per square foot increased to $274, also calculated using a rolling 3-month average, marking a modest 1.1% rise from last year. These pricing metrics reflect a high valuation of property space and ongoing demand in the market.
In summary, the residential real estate market adjacent to Riverboat Dr. (north and south) as of May 2024 is characterized by increased active listings and a higher months supply of inventory, suggesting a more balanced market. The absence of closed sales for the month indicates a need for further analysis to understand the underlying factors. The substantial increase in average sales prices, combined with a slight rise in price per square foot, underscores the strong demand and high property valuations in the area. Buyers and sellers in the Riverboat Dr. area should work closely with experienced real estate professionals to navigate these evolving market dynamics and make informed decisions.
Note: The above data is not intended to be a comparative market analysis for any one particular home. The above data provides an average valuation for homes sold in this area for the specified period.
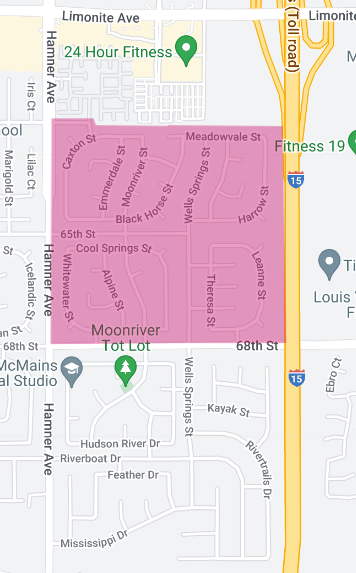
Area 7: Country Springs/ Cimmaron Ranch
(Western Edge of 91752 ZIP Code, Eastvale, CA)
End of Month Active Listings: 1, 0.0% change from a year ago.
New Listings: 1, 0.0% change from a year ago.
Months Supply Inventory: .9, +50.0% change from a year ago.
Closed Sales: 0 , 0.0% change from a year ago.
Average Days on Market: no data due to no closed sales
List to Sold Price %: no data due to no closed sales
Average Sales Price: $855,000, -0.5% change from a year ago, calculated using a 3-month rolling average.
Average Price Square Foot: $281, -1.7% change from a year ago, calculated using a 3-month rolling average.
As of the end of May 2024, the residential real estate market in the Country Springs-Cimmaron Ranch area has exhibited stability in several key metrics, alongside some shifts in inventory and pricing. Below is a detailed analysis of the current market conditions based on the latest data.
The number of active listings in Country Springs-Cimmaron Ranch at the end of May was 1, with no change from the same period last year. This stable inventory level indicates a consistent availability of homes for prospective buyers. Similarly, the market saw 1 new listing during May, unchanged from last year, suggesting a steady inflow of fresh inventory.
The months supply of inventory has increased to 0.9 months, reflecting a 50.0% rise from last year. This metric indicates a slight shift towards a more balanced market, although it still favors sellers due to the limited supply relative to demand.
There were no closed sales in May, consistent with the same number from last year. The absence of closed transactions means there is no available data for average days on market or the list-to-sold price percentage for this period. This lack of closed sales could be due to various factors, including potential seasonal variations or other market dynamics.
The average sales price in Country Springs-Cimmaron Ranch, calculated using a rolling 3-month average, stood at $855,000. This figure represents a slight 0.5% decrease from last year, indicating stable property values within the area. Additionally, the average price per square foot decreased to $281, also calculated using a rolling 3-month average, marking a modest 1.7% decline from last year. These pricing metrics suggest a slight adjustment in the valuation of property space, reflecting minor shifts in market dynamics.
In summary, the Country Springs-Cimmaron Ranch residential real estate market as of May 2024 is characterized by stable active listings and new listings, with a slight increase in the months supply of inventory. The absence of closed sales for the month indicates a need for further analysis to understand the underlying factors. The slight decreases in average sales prices and price per square foot suggest minor adjustments in the market. Buyers and sellers in Country Springs-Cimmaron Ranch should work closely with experienced real estate professionals to navigate these evolving market conditions and make informed decisions.
Note: The above data is not intended to be a comparative market analysis for any one particular home. The above data provides an average valuation for homes sold in this area for the specified period.
Area 8: Stratford Township Homes
(Western Edge of Jurupa Valley 91752)
End of Month Active Listings: 4, +100.0% change from year ago,
New Listings: 4, 0.0% change from year ago,
Months Supply Inventory: 2.2, +175.0% change from year ago,
Closed Sales: 3 , no data re change from a year ago,
Average Days on Market: 36, no data re change from a year ago,
List to Sold Price %: 93.8%, no data re change from a year ago,.
Highest Closed price: 1,000,000.00
Average Sales Price: $855,633, no data re change from a year ago,
Average Price Square Foot: $385, no data re change from a year ago,
As of the end of May 2024, the residential real estate market in Stratford Township has exhibited notable changes, particularly in inventory levels, sales activity, and pricing dynamics. Below is a comprehensive analysis of the current market conditions based on the latest data.
The number of active listings in Stratford Township at the end of May was 2, with no comparative data available from last year. This stable inventory level suggests a consistent availability of homes for prospective buyers. Similarly, the market saw 1 new listing during May, unchanged from last year, indicating a steady inflow of fresh inventory.
The months supply of inventory stands at 1.7 months, with no change from last year. This metric suggests a balanced market, where the supply of homes aligns with the demand, allowing for healthy competition among buyers.
Closed sales in May totaled 1, representing a 50.0% decrease from last year. This significant drop in closed transactions highlights reduced sales activity, possibly due to the constrained inventory. However, the average days on market for properties in Stratford Township decreased to 12 days, a 40.0% reduction from last year. This decline suggests that properties are selling more quickly, reflecting strong buyer interest and efficient market activity.
The list-to-sold price percentage increased to 104.6%, reflecting a 2.4% rise from last year. This figure indicates that homes are selling for above their asking prices on average, underscoring a competitive market where buyers are willing to bid higher to secure a purchase.
The average sales price in Stratford Township, calculated using a rolling 3-month average, stood at $930,000. This figure represents a substantial 22.1% increase from last year, highlighting significant appreciation in property values within the area. Conversely, the average price per square foot decreased to $274, also calculated using a rolling 3-month average, marking a 6.5% decline from last year. This decrease suggests potential changes in the types of properties being sold or a shift in buyer preferences.
In summary, the Stratford Township residential real estate market as of May 2024 is characterized by stable active and new listings, a balanced months supply of inventory, and quick sales activity. The market remains competitive, with properties selling above their asking prices. The substantial increase in average sales prices, combined with a slight decrease in price per square foot, indicates strong market dynamics and ongoing demand for properties in the area. Buyers and sellers in Stratford Township should work closely with experienced real estate professionals to navigate these evolving market conditions and make informed decisions.
Note: The above data is not intended to be a comparative market analysis for any one particular home. The above data provides an average valuation for homes sold in this area for the specified period.
AREA 9: Eastvale Estates (Bellegrave Ave./Hamner Ave/)
(Western Edge of 91752 ZIP Code, Eastvale, CA)
End of Month Active Listings: 0, 0.0% change from a year ago.
New Listings: 0, 0.0% change from a year ago.
Months Supply Inventory: no data
Closed Sales: 1, 0.0% change from a year ago.
Average Days on Market: 11, +120.0%.
List to Sold Price %: 98.7%, -1.4% change from last year.
Average Sales Price: $820,001, +5.7% change from last year, calculated using a rolling 3-month average.
Average Price Square Foot: $364, +32.4% change from last year, calculated using a rolling 3-month average.
As of the end of May 2024, the residential real estate market in Eastvale Estates has demonstrated a mix of stability and significant changes in key metrics. Below is a comprehensive analysis of the current market conditions based on the latest data.
The number of active listings in Eastvale Estates at the end of May was 0, with no change from the same period last year. Similarly, there were no new listings during May, indicating a consistent lack of fresh inventory in the market compared to last year.
The months supply of inventory data is unavailable due to the absence of active listings. This suggests a potential challenge for buyers seeking homes in this area, highlighting the scarcity of available properties.
Closed sales in May totaled 1, with no change from last year. The average days on market for properties in Eastvale Estates was 11 days, representing a substantial 120.0% increase from last year. This increase indicates that the single property sold took longer to sell compared to the same period last year, reflecting changes in buyer behavior or market dynamics.
The list-to-sold price percentage was 98.7%, reflecting a 1.4% decrease from last year. This figure indicates that homes are selling for slightly below their asking prices on average, suggesting a more balanced negotiation environment between buyers and sellers.
The average sales price in Eastvale Estates, calculated using a rolling 3-month average, stood at $820,001. This figure represents a 5.7% increase from last year, highlighting moderate appreciation in property values within the area. Additionally, the average price per square foot increased to $364, also calculated using a rolling 3-month average, marking a significant 32.4% rise from last year. These metrics reflect a higher valuation of property space, indicating strong demand and value for properties in the area.
In summary, the Eastvale Estates residential real estate market as of May 2024 is characterized by a lack of active and new listings, stable closed sales, and increased average days on market. The market remains competitive, with properties selling slightly below their asking prices. The increases in average sales prices and price per square foot indicate strong demand and high property valuations. Buyers and sellers in Eastvale Estates should work closely with experienced real estate professionals to navigate these evolving market dynamics and make informed decisions.
Note: The above data is not intended to be a comparative market analysis for any one particular home. The above data provides an average valuation for homes sold in this area for the specified period.
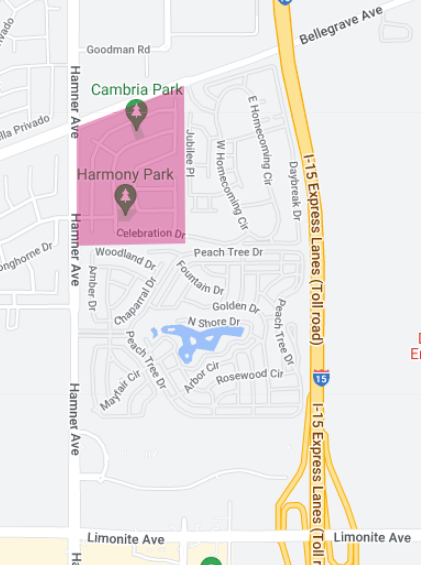
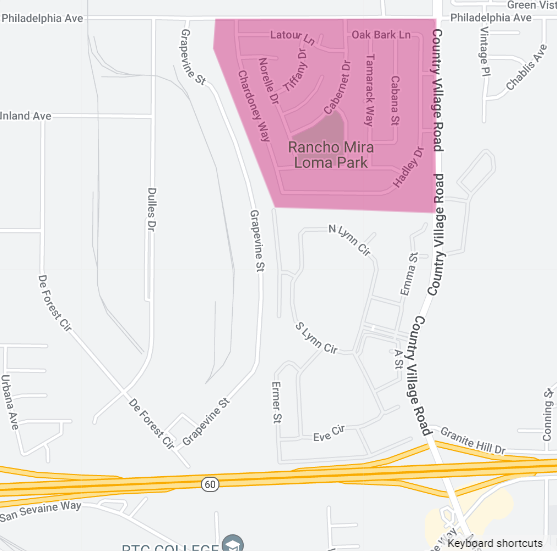
Area 10: Harvest Villages at Vernola Ranch
(Western Edge of Jurupa Valley 91752)
End of Month Active Listings: 5, +400.0% change from last year
New Listings: 3 , no change data from last year
Months Supply Inventory: 3.3 , +266.7% change from last year
Closed Sales: 1, 0.0% change from last year
Average Days on Market: 14, -30.0% change from last year.
List to Sold Price %: 107.1%, +11.2% change from last year.
Average Sales Price: $1,050,000 , +8.4% change from last year, calculated using a rolling 3-month average.
Average Price Square Foot: $256 , -1.2% change from last year, calculated using a rolling 3-month average.
As of the end of May 2024, the residential real estate market in Harvest Villages has demonstrated significant changes, particularly in inventory levels and pricing dynamics. Below is a comprehensive analysis of the current market conditions based on the latest data.
The number of active listings in Harvest Villages at the end of May was 5, representing a substantial 400.0% increase compared to the same period last year. This significant rise in active listings suggests a greater availability of homes for prospective buyers, contributing to a more balanced market. The market saw 3 new listings during May, with no change from last year, indicating a steady inflow of fresh inventory.
The months supply of inventory has increased to 3.3 months, reflecting a 266.7% rise from last year. This metric indicates a shift towards a more balanced market, suggesting that it would take over three months to sell the current inventory at the present rate of sales.
Closed sales in May totaled 1, with no change from last year. The average days on market for properties in Harvest Villages decreased to 14 days, a 30.0% reduction from last year. This decline suggests that properties are selling more quickly, reflecting strong buyer interest and efficient market activity.
The list-to-sold price percentage increased to 107.1%, reflecting an 11.2% rise from last year. This figure indicates that homes are selling for well above their asking prices on average, underscoring a highly competitive market where buyers are willing to bid higher to secure a purchase.
The average sales price in Harvest Villages, calculated using a rolling 3-month average, stood at $1,050,000. This figure represents an 8.4% increase from last year, highlighting significant appreciation in property values within the area. Conversely, the average price per square foot decreased slightly to $256, also calculated using a rolling 3-month average, marking a 1.2% decline from last year. This minor decrease suggests potential variations in the types of properties being sold or a shift in buyer preferences.
In summary, the Harvest Villages residential real estate market as of May 2024 is characterized by increased active listings and a higher months supply of inventory, indicating a more balanced market. Properties are selling quickly and for well above their asking prices. The substantial increase in average sales prices, combined with a slight decrease in price per square foot, reflects strong market dynamics and ongoing demand for properties in the area. Buyers and sellers in Harvest Villages should work closely with experienced real estate professionals to navigate these evolving market conditions and make informed decisions.
Note: The above data is not intended to be a comparative market analysis for any one particular home. The above data provides an average valuation for homes sold in this area for the specified period.
Area 11: Mira Loma Village,
(North-Western portion of Jurupa Valley 91752)
End of Month Active Listings: 0, 0.0% change from last year.
New Listings: 0, 0.0% change from last year.
Months Supply Inventory: no inventory
Closed Sales: 0, 0.0% change from last year.
Average Days on Market: No Data due to no closed sales.
List to Sold Price %: No Data due to no closed sales.
Average Sales Price: $597,500 , calculated using a rolling 12-month average, +81.1% change from last year.
Average Price Square Foot: $453, calculated using a rolling 12-month average, +41.6% change from last year.
Since January 1, 2023, 2 houses were sold, one in February 2023 listed for $610,000 and sold for $615,000. The second house sold in August 2023, listed for $525,000 and sold for $580,000.
As of the end of May 2024, the residential real estate market in Mira Loma Village has shown significant changes, particularly in terms of sales and pricing dynamics. Below is a comprehensive analysis of the current market conditions based on the latest data.
The number of active listings in Mira Loma Village at the end of May was 0, with no change from the same period last year. Similarly, there were no new listings during May, unchanged from last year. This indicates a consistent lack of fresh inventory in the market compared to last year.
Due to the absence of active listings and new inventory, there is no data available for months supply of inventory, which highlights a potential challenge for buyers seeking homes in this area. This scarcity of available properties suggests a tight market.
There were no closed sales in May, consistent with the same number from last year. Consequently, there is no data available for average days on market or the list-to-sold price percentage for this period. The absence of closed sales could be due to various factors, including seasonal variations or other market dynamics.
The average sales price in Mira Loma Village, calculated using a rolling 12-month average, stood at $597,500. This figure represents a substantial 81.1% increase from last year, highlighting significant appreciation in property values within the area. Additionally, the average price per square foot increased to $453, also calculated using a rolling 12-month average, marking a 41.6% rise from last year. These metrics reflect a higher valuation of property space, indicating strong demand and value for properties in the area.
Since January 1, 2023, two houses have been sold in Mira Loma Village. The first house, sold in February 2023, was listed for $610,000 and sold for $615,000. The second house, sold in August 2023, was listed for $525,000 and sold for $580,000. These sales indicate a strong market where properties are selling above their listing prices, reflecting competitive bidding among buyers.
In summary, the Mira Loma Village residential real estate market as of May 2024 is characterized by a lack of active and new listings, indicating a tight market with limited inventory. The absence of closed sales suggests potential challenges in market activity. However, the significant increases in average sales prices and price per square foot highlight strong demand and high property valuations. Buyers and sellers in Mira Loma Village should work closely with experienced real estate professionals to navigate these evolving market dynamics and make informed decisions.
Note: The above data is not intended to be a comparative market analysis for any one particular home. The above data provides an average valuation for homes sold in this area for the specified period.
Area 12: Homestead,
(North-Western portion of Jurupa Valley 91752)
End of Month Active Listings: 0, no change from last year data
New Listings: 1, 0.0% change from last year
Months Supply Inventory: no data
Closed Sales: 2 , +100.0% change from last year.
Average Days on Market: 4, -55.6% change from last year
List to Sold Price %: 101.1% , +1.1% change from last year.
Average Sales Price: $591,500 , +12.7% change from last year.
Average Price Square Foot: $528, +12.3% change from last year.
As of the end of May 2024, the residential real estate market in the Homestead area has shown several noteworthy changes, particularly in sales activity and pricing dynamics. Below is a comprehensive analysis of the current market conditions based on the latest data.
The number of active listings in Homestead at the end of May was 0, with no change from the same period last year. This indicates a continued lack of active inventory in the market, suggesting limited options for prospective buyers. There was 1 new listing during May, unchanged from last year, indicating a steady inflow of fresh inventory.
Due to the absence of active listings, there is no data available for months supply of inventory. This lack of inventory data highlights the potential challenge for buyers in finding available properties in the area.
Closed sales in May totaled 2, representing a 100.0% increase from last year. This significant rise in closed transactions indicates improved market activity and stronger buyer demand. The average days on market for properties in Homestead decreased to 4 days, reflecting a 55.6% reduction from last year. This sharp decline suggests that properties are selling very quickly, reflecting heightened buyer interest and swift decision-making.
The list-to-sold price percentage increased to 101.1%, reflecting a 1.1% rise from last year. This figure indicates that homes are selling for slightly above their asking prices on average, underscoring a competitive market where buyers are willing to bid higher to secure a purchase.
The average sales price in Homestead stood at $591,500, representing a 12.7% increase from last year. This figure highlights notable appreciation in property values within the area. Additionally, the average price per square foot increased to $528, marking a 12.3% rise from last year. These metrics reflect a higher valuation of property space, indicating strong demand and value for properties in the area.
In summary, the Homestead residential real estate market as of May 2024 is characterized by a lack of active listings, steady new listings, and significant improvements in closed sales and average sales prices. Properties are selling quickly and for slightly above their asking prices, highlighting strong demand and high property valuations. Buyers and sellers in Homestead should work closely with experienced real estate professionals to navigate these evolving market dynamics and make informed decisions.
Note: The above data is not intended to be a comparative market analysis for any one particular home. The above data provides an average valuation for homes sold in this area for the specified period.
******
As a real estate broker, understanding the above-nuanced market shifts is key to providing informed advice and strategy to sellers throughout the 91752 zip code area.
Contact me to understand how the above trends can impact your real estate decisions. I provide expert guidance and strategic insights and can guide you through these interesting times in real estate.
Manny Barba
Broker-Attorney-Realtor®
951-990-3998
MB Live Realty, Inc.
Note: All data in this report is from California Regional Multiple Listing Service (CRMLS) All information should be independently reviewed and verified for accuracy. This report is for informational purposes only and not intended as financial or investment advice.

No Comments