Area 11- W of Van Buren-N of Limonite -Jurupa Valley Residential Real Estate Market Update-October 2023
Jurupa Valley 92509
Residential Real Estate Market Update
October 2023
Area of Focus:
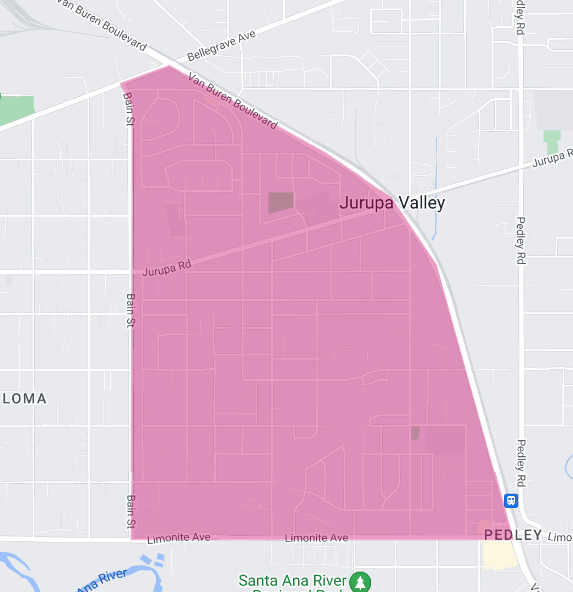
11- W of Van Buren-N of Limonite (See Map)
This report focuses on the residential real estate market in the City of Jurupa Valley, specifically in the area west of Van Buren Blvd and north of Limonite, as of the end of October 2023.
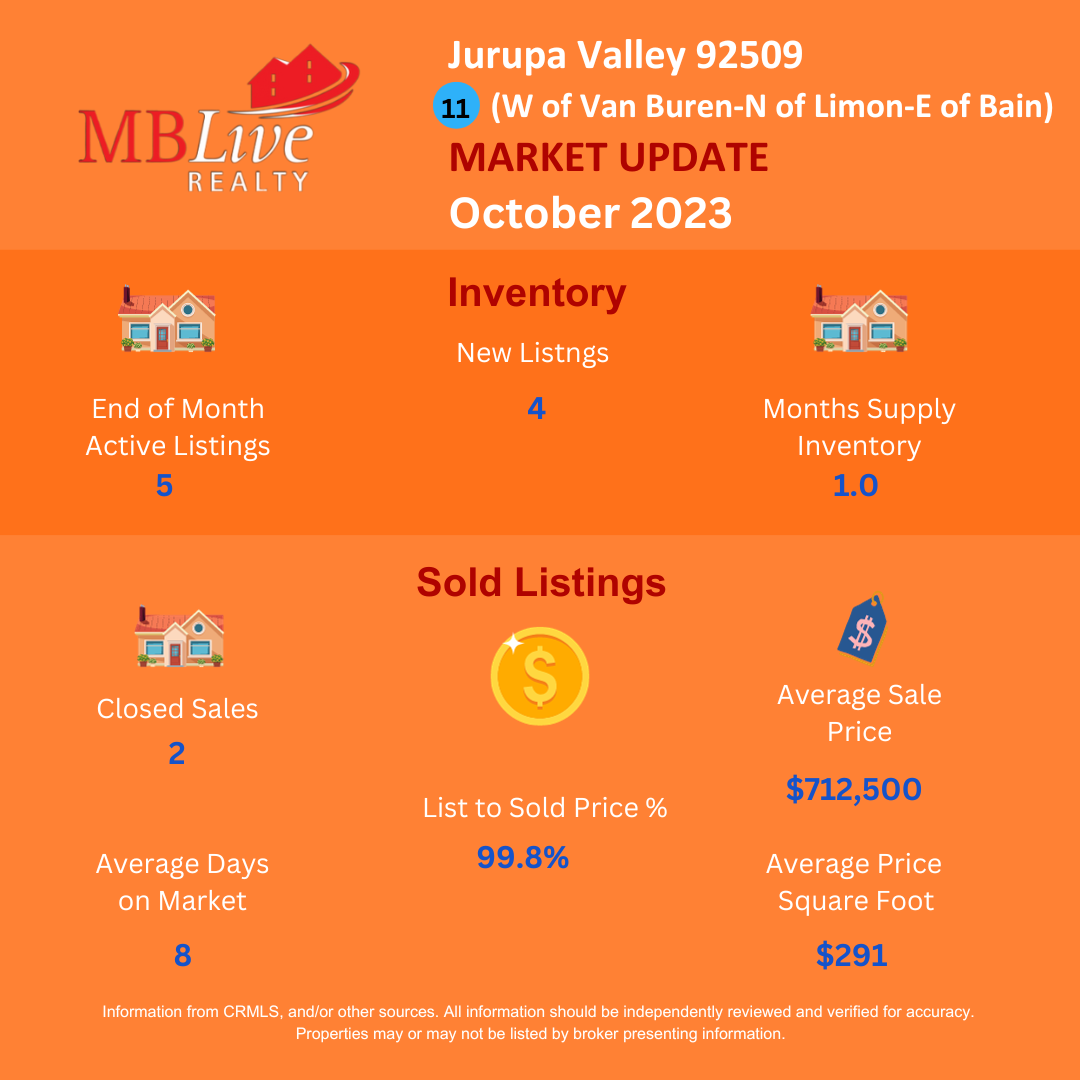
End of Month Active Listings
Current Status: There were only 5 active listings at the end of October.
Yearly Comparison: This represents a drastic decrease of 82.1% compared to the same period last year, indicating a significant contraction in the number of available properties.
New Listings
Current Status: The area saw only 4 new listings throughout the month.
Yearly Comparison: This is a 60.0% decrease from a year ago, reflecting a substantial slowdown in new properties entering the market.
Months Supply Inventory
Current Status: The inventory stood at just 1.0 month.
Yearly Comparison: This is an 84.8% decrease from the previous year, suggesting an extremely tight market with limited options for buyers.
Closed Sales
Current Status: There were 2 closed sales in October.
Yearly Comparison: This is a 50.0% decrease from a year ago, indicating a slowdown in sales activity.
Average Days on Market
Current Status: Homes were on the market for an average of 8 days.
Yearly Comparison: This is a 14.3% increase from the previous year, implying a slightly longer selling period for properties.
List to Sold Price Percentage
Current Status: The list to sold price percentage averaged 99.8%.
Yearly Comparison: This is a slight increase of 1.3% from last year, indicating that homes are selling very close to their listing prices.
Average Sales Price
Current Status: The average sales price was $712,500.
Yearly Comparison: This shows a significant increase of 20.5% from last year, suggesting a substantial appreciation in property values.
Average Price per Square Foot
Current Status: The average was $291 per square foot.
Yearly Comparison: This represents a decrease of 33.9% from the previous year, which might indicate a shift in the types of properties sold or market adjustments.
Conclusions
The Jurupa Valley real estate market in the specified area, as of October 2023, is characterized by a notable contraction in supply, with significantly fewer active and new listings compared to last year.
The drastic reduction in months supply inventory highlights a seller’s market with limited choices for potential buyers.
While the closed sales have decreased, the increase in average sales price indicates a strong market for sellers, with properties appreciating in value.
However, the drop in the average price per square foot and the slight increase in average days on market could suggest a changing market dynamic, possibly influenced by the types of properties being sold or broader economic factors.
The near-equivalence of list to sold prices reflects a market where homes are selling close to their asking prices, reinforcing the notion of a strong seller’s market in this specific area of Jurupa Valley.
For a comprehensive understanding of how these trends can impact your real estate decisions, contact me. I provide expert guidance and strategic insights and can guide you through these interesting times in real estate.
And for a detailed and personalized analysis of your home, or if you have any questions, feel free to contact me. I am committed to providing accurate and updated information to assist you in all your real estate needs.
Manny Barba
Broker-Attorney-Realtor®
951-990-3998
MB Live Realty, Inc.
Note: All data in this report is from California Regional Multiple Listing Service (CRMLS) All information should be independently reviewed and verified for accuracy. This report is for informational purposes only and not intended as financial or investment advice.


No Comments