Area 3-Rubidoux-S of 60 frwy-Jurupa Valley Residential Real Estate Market Update-October 2023
Jurupa Valley 92509
Residential Real Estate Market Update
October 2023
Area of Focus:
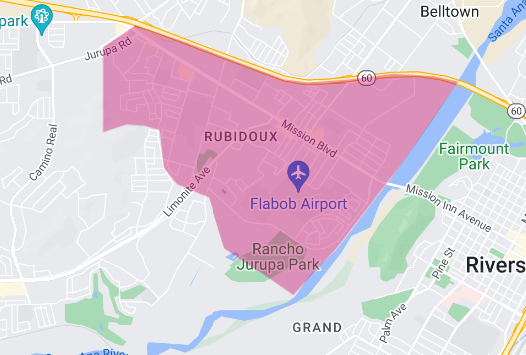
3-Rubidoux-S of 60 frwy (see map)
Current Market Conditions
As of the end of October 2023, the Rubidoux residential real estate market presents a mixed bag of trends, with activity slowing in some areas while prices show resilience in others. A deeper dive into the numbers reveals a nuanced market that requires a strategic approach from both buyers and sellers.
Inventory and Listings
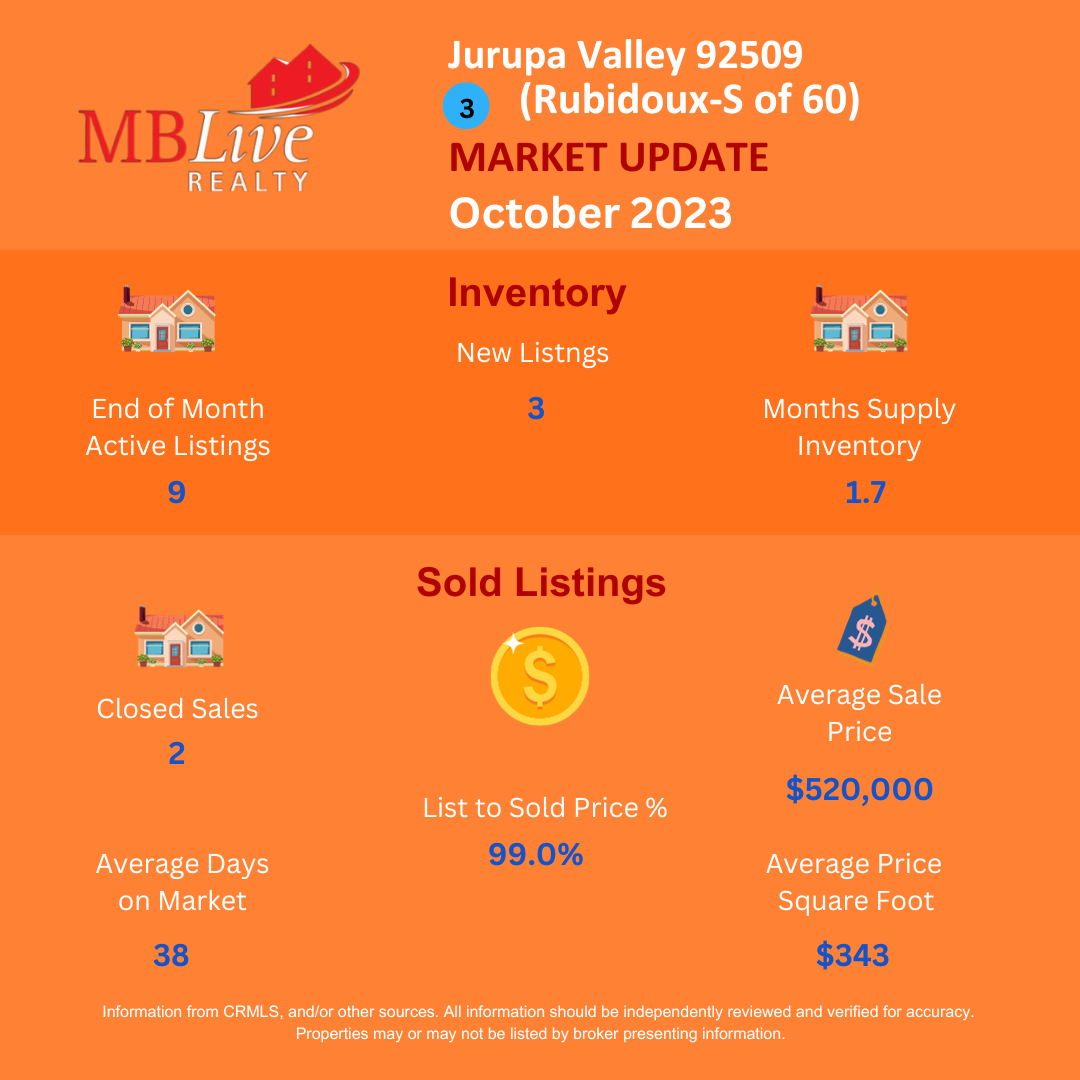
The month ended with 9 active listings, marking a 47.1% decrease from the previous year. This reduction reflects a tighter market where buyers have fewer homes to choose from. New listings also saw a decrease, with 3 new properties hitting the market, 40.0% less than last year, further pointing to a limited inventory landscape.
Sales and Market Velocity
The market’s velocity has slowed, with closed sales at 2, a significant 71.4% drop from last year. Homes spent an average of 38 days on the market before sale, a slight increase of 2.7% from the previous year, indicating a slight cooling and more negotiation room for buyers.
Pricing Dynamics
Despite a cooler sales pace, pricing dynamics indicate strength. The List to Sold Price ratio stood firm at 99.0%, a positive 2.6% change from last year, showing that homes sold very close to their asking prices. The average sales price experienced a decrease to $520,000, a 9.6% dip from last year, which may reflect a shift in the types of homes sold or buyers’ price sensitivities.
Per Square Foot Valuation
The Average Price per Square Foot came in at $343, representing a 5.2% increase from the previous year, suggesting that while overall prices have dipped, the value of the space itself remains robust.
Comparison with September 2023
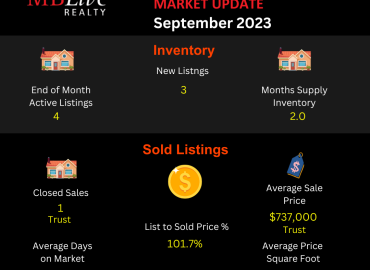
When we compare October’s metrics with September, we observe some interesting shifts. Both months had the same number of active listings at the end of the month, but September boasted a higher number of new listings and closed sales. September’s market was notably brisker, with homes spending less than half the time on the market compared to October. Additionally, September’s List to Sold Price ratio exceeded October’s, with homes selling for more than their list price on average.
Conclusions
The October market in Rubidoux has shown that while buyer demand may be softening somewhat, as evidenced by fewer closed sales and longer days on market, the value of property remains strong, reflected in the increased average price per square foot. This indicates that while the market may be shifting, Rubidoux’s appeal remains high.
Market Outlook and Advice For potential sellers, pricing strategies will be crucial in attracting serious buyers, especially in a market where homes are sitting a bit longer.
Buyers, on the other hand, may find more room to negotiate but will need to act decisively to secure homes that are well-valued, particularly given the market’s lower inventory levels.
Next Steps
For a comprehensive understanding of how these trends can impact your real estate decisions, contact me. I provide expert guidance and strategic insights and can guide you through these interesting times in real estate.
For a detailed and personalized analysis of your home, or if you have any questions, feel free to contact me. I am committed to providing accurate and updated information to assist you in all your real estate needs.
Manny Barba
Broker-Attorney-Realtor®
951-990-3998
MB Live Realty, Inc.
Note: All data in this report is from California Regional Multiple Listing Service (CRMLS) All information should be independently reviewed and verified for accuracy. This report is for informational purposes only and not intended as financial or investment advice.


No Comments